Data Visualization
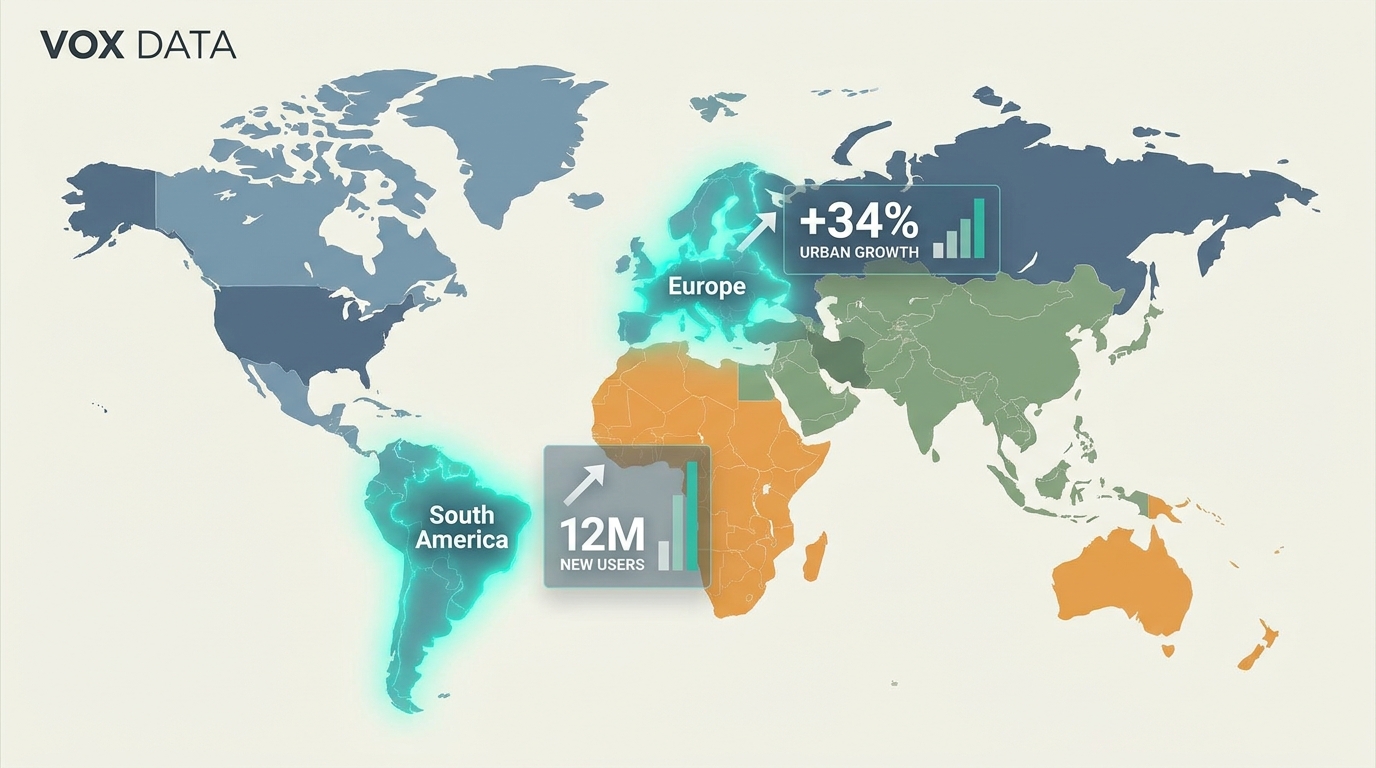
An animated data/stats/chart video (data-journalism motion graphics).
Generate a data journalism-style explainer in the style of Vox or The New York Times — animated maps, bar charts racing upward, statistics appearing with dramatic weight, and a journalist's narrative connecting the dots
Opens the Wavemaker composer with this style pre-selected.
Data Visualization is an AI education & explainers video style — an animated data/stats/chart video (data-journalism motion graphics). Wavemaker generates the entire video for you — script, visuals, voiceover, and music — and assembles a finished, ready-to-share piece in minutes.
Pick Data Visualization, describe your idea or paste a URL, and Wavemaker applies the style's tuned recipe (its look, pacing, framing, voice, and structure) to your content. Refine any scene in plain language, then export in the aspect ratio you need (vertical, square, or widescreen).
How to create a data visualization video
-
Describe your video
Paste a link or type a one-line brief. Wavemaker reads it, pulls your brand, and plans the scenes, script, and pacing for you.
-
Pick a style
Choose one of the styles on this page. Each is a tuned recipe — look, cut rhythm, voice, and structure — applied automatically to your brief.
-
Generate and refine
Wavemaker writes the script, generates every shot and voiceover, and assembles a finished video. Tweak any scene in chat or on the canvas, then export.
Data Visualization — FAQs
What is the Data Visualization video style?
Data Visualization is a education & explainers style on Wavemaker — an animated data/stats/chart video (data-journalism motion graphics). Selecting it steers the whole generation — look, cut rhythm, voice, and scene structure — toward that result, so you get a consistent Data Visualization feel without configuring anything.
How do I make a Data Visualization video?
Open the Wavemaker composer, choose Data Visualization, describe your idea (or paste a link), and Wavemaker writes the script, generates the visuals and voiceover, and assembles the video. Tweak any scene in chat and export.
What aspect ratios can I export?
Vertical (9:16) for TikTok, Reels, and Shorts, square (1:1), and widescreen (16:9) for YouTube and the web. Some styles default to the ratio that performs best for their format.
Can I turn a document into a video?
Yes — upload a PDF, doc, or paste text, and Wavemaker summarizes the key points into a structured explainer.
Does it narrate the explanation?
A clear voiceover narrates the script, and on-screen text reinforces the key terms and steps.
How long are explainers?
Most run 30–90 seconds. You can set a target length and Wavemaker fits the script and pacing to it.
More Education & Explainers styles
-
 Animated Explainer An animated flat-2D-vector explainer (Kurzgesagt/Vox/TED-Ed concept animation).
 -
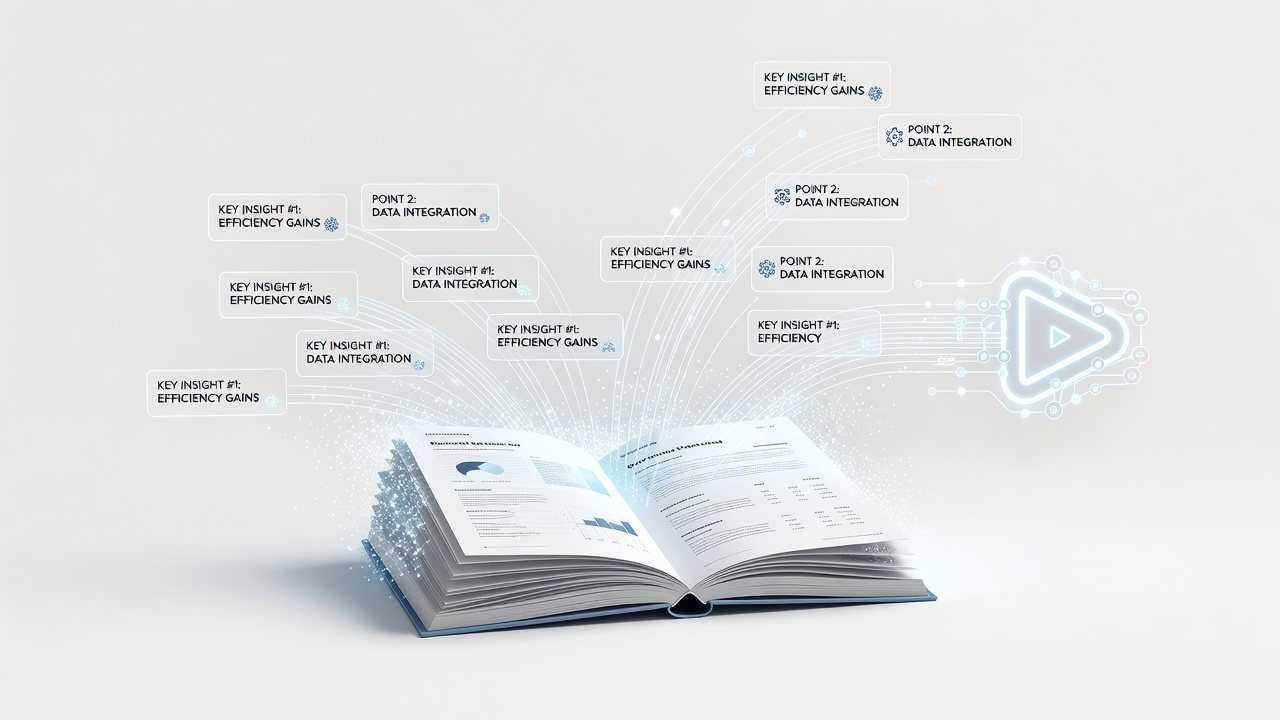
 Book Summary A book/big-idea summary ('X in 60 seconds' — opinionated distillation of a book's ideas).
 -
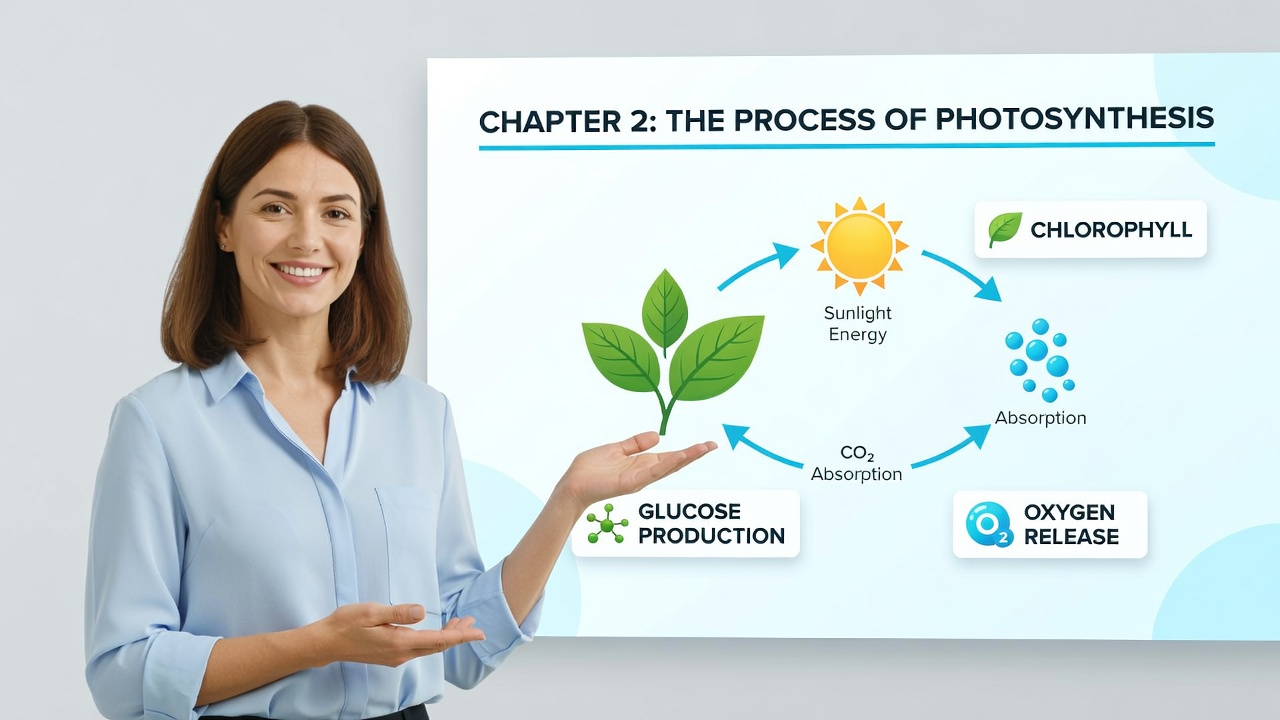 Course Lesson A structured e-learning lesson module (objective, concept build, example, recap).
 -
 Document to Video Turn a written article/PDF/whitepaper into a narrated video.
 -
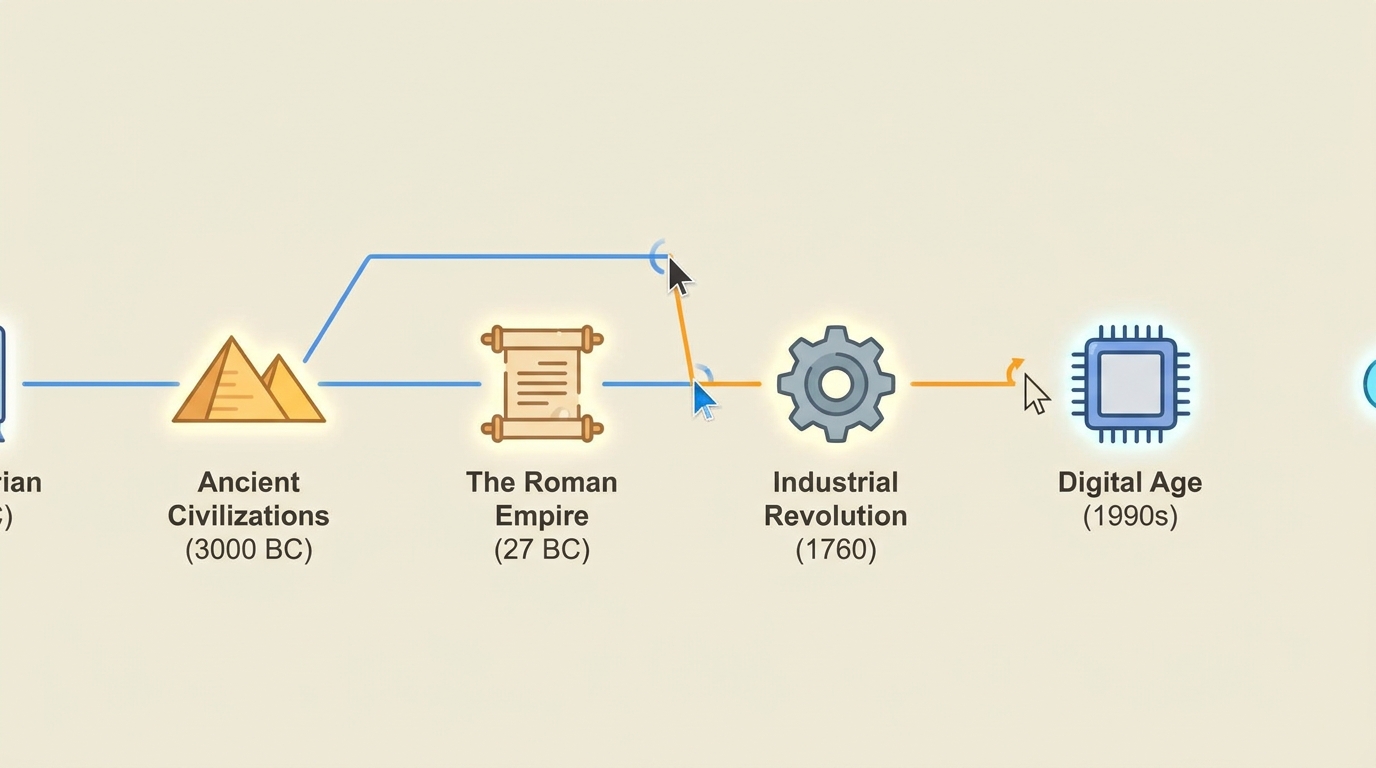 Historical Recap A 'story of X' historical recap told as a cinematic narrative.
 -
 How-To / Tutorial A step-by-step how-to / tutorial / SOP for a physical or general task.